
1. Profitability Crisis in 2024
BP’s 2024 financial results reveal a staggering decline in profitability, underscoring severe operational and external challenges:
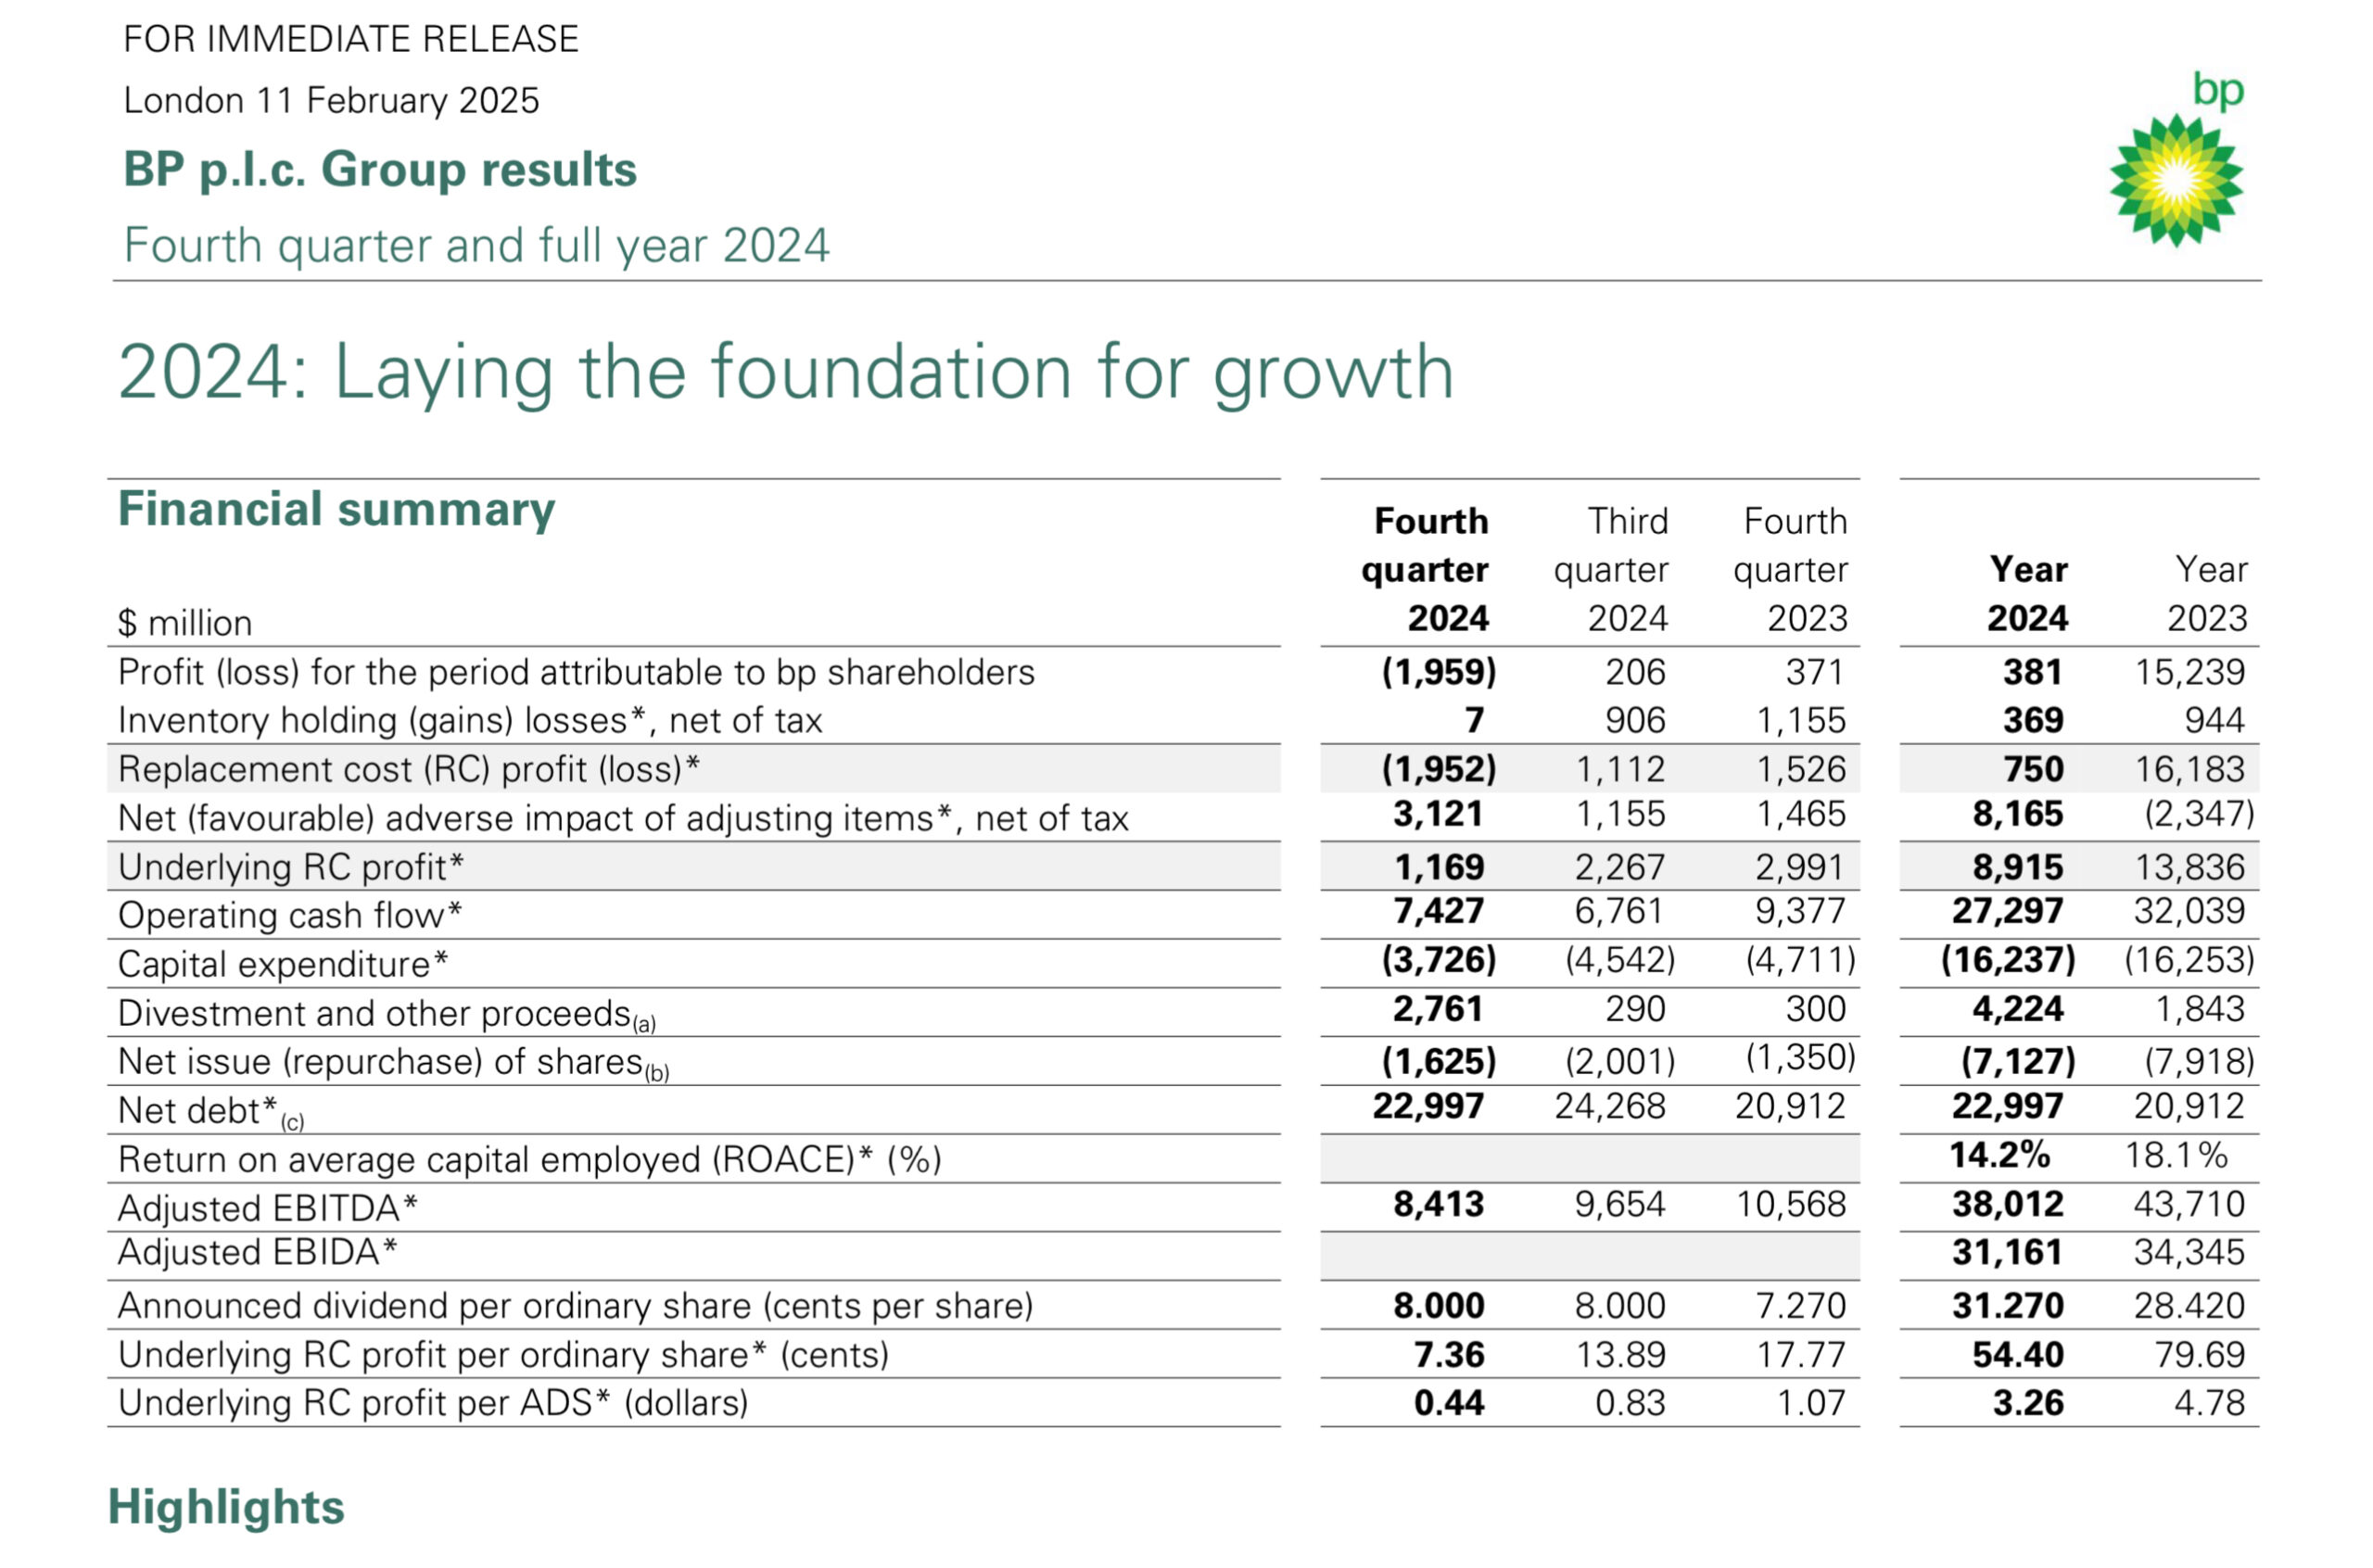
- Full-Year Profit Attributable to Shareholders: Collapsed by 97% from $15.2B (2023) to $381M (2024).
- Q4 2024 Net Loss: $2.0B, a sharp reversal from $371M profit in Q4 2023.
- Underlying RC Profit: Dropped 35% YoY to $8.9B, far worse than Shell’s 20% decline and Exxon’s 15% dip.
Key Drivers of Decline:
- Plummeting Refining Margins: BP’s Customers & Products segment posted a $2.4B Q4 loss (vs. $23M profit in Q3), driven by weak demand and oversupply in global markets.
- Green Energy Underperformance: Despite a $1.8B Q4 profit in Gas & Low Carbon Energy, returns from renewables (e.g., wind, solar) lagged fossil fuel margins, contributing to broader earnings weakness.
2. Strategic Pivot: Retreat from “Massive Green Investments”
BP has quietly recalibrated its much-publicized green transition strategy, prioritizing short-term fossil fuel returns over aggressive renewable spending:
- Reduced Green Capex: While BP still targets 50GW renewable capacity by 2030, 2024 investments skewed toward high-margin oil projects (e.g., Gulf of Mexico drilling) and gas trading. Only 20% of 2024 capex went to renewables, down from 30% in 2022.
- Industry Comparison: Contrasts with TotalEnergies, which allocated 35% of 2024 capex to renewables.
- Gas Focus: Gas & Low Carbon Energy profits rose 80% QoQ to $1.8B in Q4, reflecting BP’s tactical shift to monetize gas demand during the energy transition.
Why the Shift?
- Investor Pressure: Shareholders demanded higher returns amid renewable projects’ slower payoffs (e.g., offshore wind delays).
- Regulatory Risks: Subsidy uncertainties in the U.S. and EU made green investments less predictable.
- Oil Market Dynamics: Brent crude’s 2024 volatility ($70–$95/barrel) incentivized short-term oil/gas investments.
3. Financial Resilience Amid Crisis
Despite the profit crash, BP maintained operational discipline:
- Operating Cash Flow: $27.3B for 2024 (down 15% YoY), still covering dividends and buybacks.
- Debt Management: Net debt reduced to $23.0B (from $24.3B in Q3), though above the “A” credit rating target range ($14–22B).
4. Future Strategy: Balancing Priorities
BP’s 2025–2026 roadmap reveals a dual focus:
- Short-Term Oil & Gas Maximization
- Ramping up Gulf of Mexico production (cost: $25/barrel vs. industry avg. $40).
- Expanding LNG contracts to capitalize on European gas demand.
- Cautious Green Transition
- Slow renewables growth: Adding 5GW annually (vs. 7GW needed for 2030 target).
- Partnership-driven approach: Collaborating with governments on hydrogen hubs to reduce capital risks.
Conclusion: Profitability vs. Transition at a Crossroads
BP’s 2024 collapse in profits and strategic retreat from aggressive green investments highlight a broader industry dilemma—how to fund long-term energy transitions while satisfying short-term shareholder demands.
Critical Implications:
- Investor Confidence at Risk: Dividend hikes (+10%) and buybacks ($7B in 2024) may prove unsustainable if profitability doesn’t recover.
- Reputation Challenges: BP’s scaled-back green ambitions clash with its net-zero pledges, risking regulatory and public backlash.
- Peer Comparisons: Shell and TotalEnergies face similar pressures but maintain higher renewable spending (25–35% of capex).
Strategic Focus Reinforced (With Tensions):
- Immediate: Restore profitability via oil/gas margins and cost cuts ($2B by 2026).
- Long-Term: Mitigate transition risks through partnerships, not solo green megaprojects.
Visual Recommendations:
- Profit Decline Heatmap: Compare BP’s 2023 vs. 2024 profits (shareholder, RC, EBITDA) against peers.
- Capex Allocation Chart: Show BP’s 2024 spending split (oil/gas vs. renewables) vs. 2022 and competitors.
Glossary Additions:
- Capex (Capital Expenditure): Funds spent to acquire/upgrade physical assets.
- LNG (Liquefied Natural Gas): Supercooled gas exported globally via tankers.
This analysis emphasizes BP’s profit free-fall and strategic pivot, contextualizing both within industry trends and investor expectations. It highlights tensions between short-term financial survival and long-term sustainability goals.
Marcel Chin-A-Lien
Petroleum and Energy Advisor
48 Years of Global, in-depth expertise, knowhow and insights.
That have generated transformative, multi billion giant fields discoveries, iconic first capitalistic new ventures in the USSR, bid rounds, added value and long term cash flow generating offshore exploration and production activities on Dutch North Sea, M&A, PSC designs, Contract negotiations.
Combined with a cross & trans discipline background of 4 petroleum post grad degrees, that fuse technical, business, commercial and management disciplines, accompanied by fluency in 7 languages in a variety of geographical, socio-cultural and business landscapes.
“ Exploration & Production integrated with Business & Commercial Development “
Drs – Petroleum Geology
Engineering Geologist – Petroleum Geology
Executive MBA International Business – Petroleum – M&A
MSc International Management – Petroleum
Energy Negotiator Association of International Negotiators (AIEN)
Certified Petroleum Geologist # 5201 – American Association Petroleum Geologists – Gold standard Certification
Chartered European Geologist # 92 – European Federation of Geologists – Gold standard Certification
Cambridge Award “ 2000 Outstanding Scientists of the 20th Century ”, UK – Gold standard Award
Paris Awards “ Innovative New Business Projects “, GDF-Suez, France – Two Gold standard Awards, Paris, 2003.
Public Profile: nl.linkedin.com/pub/marcel-chin-a-lien/9/a73/547/
Email: marcelchinalien@gmail.com
Leave a Reply